Skip to content
Back to templates
Charts & InfographicsInfographicChartEducation

Infographic Engine

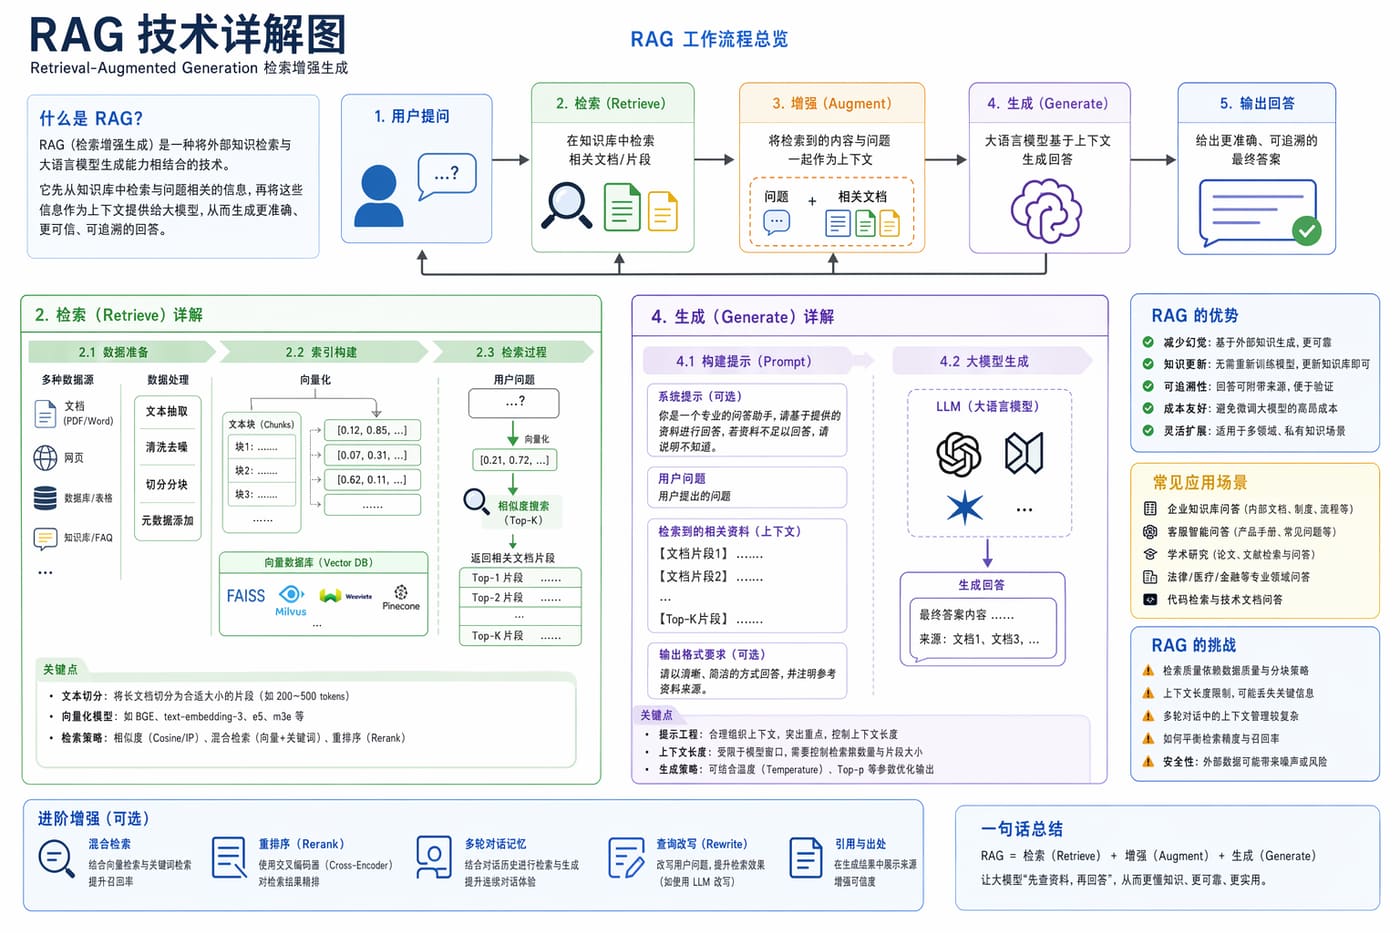
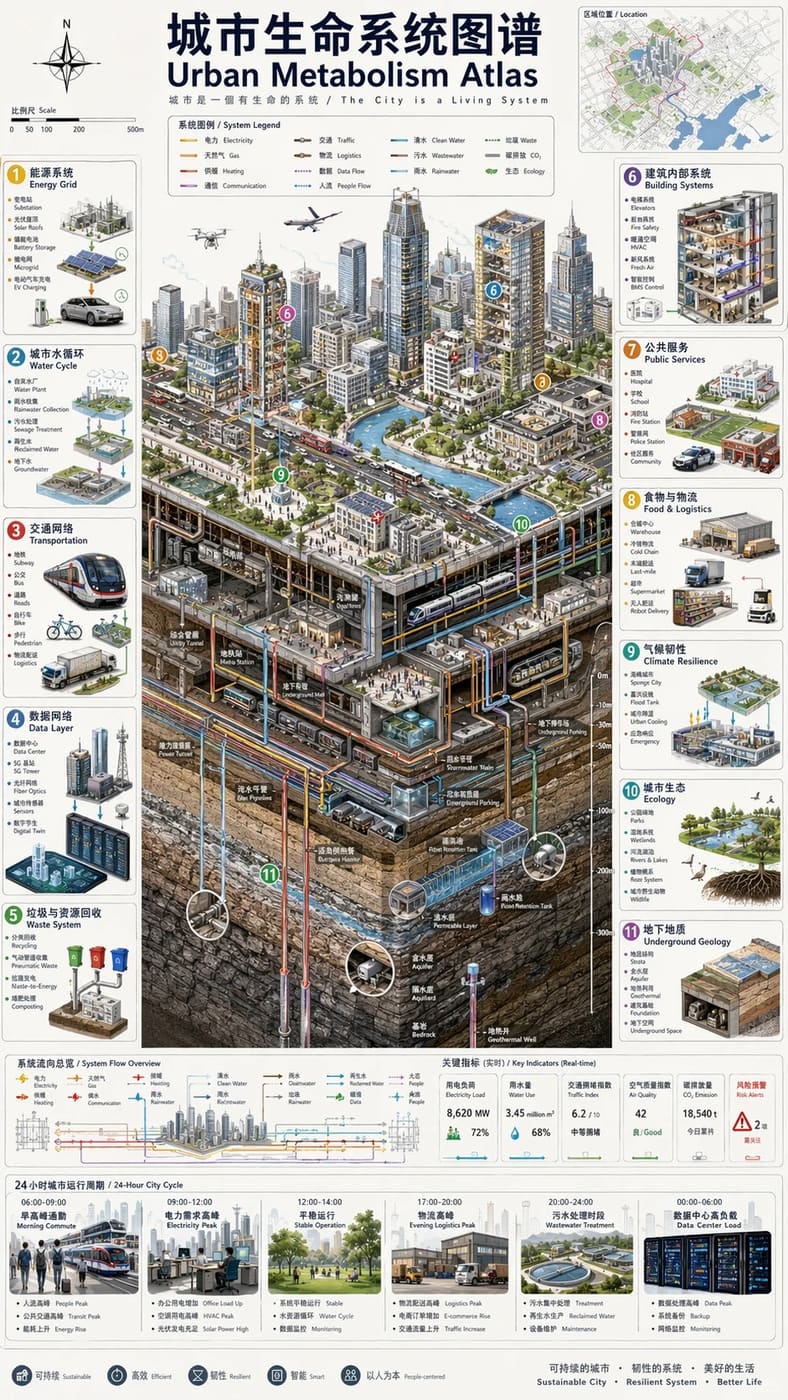
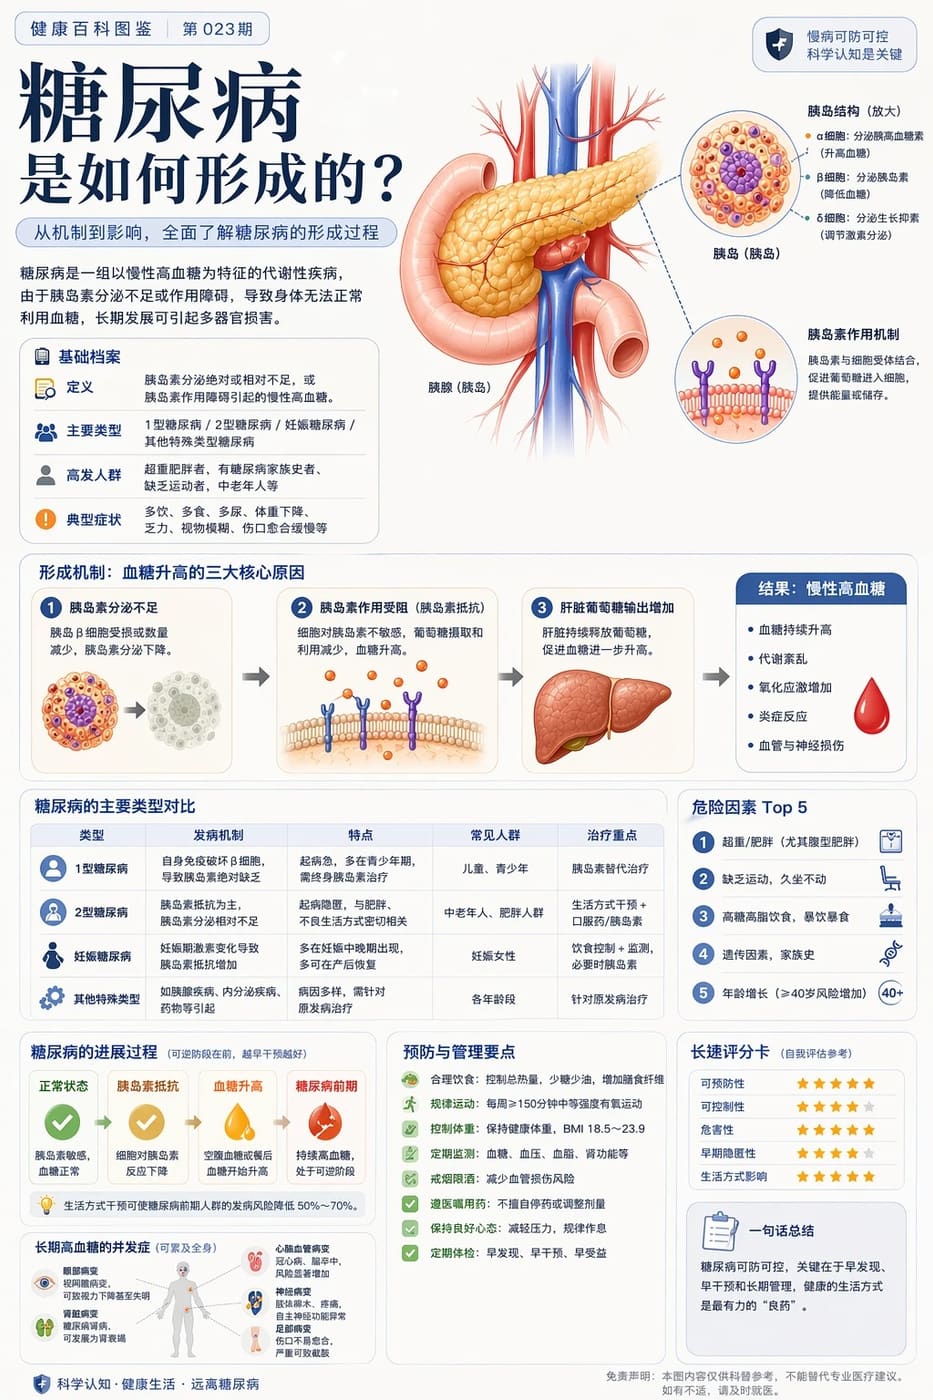
Structured diagrams, timelines, knowledge maps, and explainers.

Use when

Use for explainer graphics, technical diagrams, timelines, and knowledge cards.

What to lock down

  • Define 3-5 modules, information flow, visual hierarchy, and short labels.
  • Use color groups, arrows, icons, and clean spacing to reduce clutter.

Common pitfalls

  • Avoid long paragraphs inside the image.
  • Limit module count before adding visual detail.
InfographicChartsEducationTech

Example prompts